PRODUCTION, CONSUMPTION AND TRADE OF FISHERY PRODUCTS: CURRENT SITUATION, CHALLENGES AND PROSPECTS
After three decades of success in aquaculture and a very discreet performance in fisheries, sectoral production and foreign trade will lose dynamism in the coming years
DESCARGAR / Download
PRODUCTION, CONSUMPTION AND TRADE OF FISHERY PRODUCTS: CURRENT SITUATION, CHALLENGES AND PROSPECTS
Carlos Wurmann G
Industrial Civil Engineer, M.Sc., Economics
President of CIDEEA
President, CIDEEA, International Center for Strategic Studies in Aquaculture
Santiago de Chile, December 2024
INTRODUCTION
International trade of fishery products (hereinafter referred to as FP) has been one of the main driving forces behind the development of sectoral activity in numerous national economies in recent decades. It facilitates meeting demand in countries and regions lacking sufficient local supply while providing employment, wealth, and well-being for those with surplus production. Exchange of food items creates a "win-win" scenario for the global community, although it challenges local production structures not well-prepared to meet open competition with the rest of the world.
Recent figures show that in 2022, 8.5% of global merchandise exports were attributed to food. In Latin America and the Caribbean (LAC), this percentage reached 23.6%, while in the European Union (EU), it was only 9.8%. Moreover, FAO indicates that fishery trade accounted for 9.1% of global agricultural trade and 1% of the total value of merchandise trade in 2022, underscoring the importance of international food trade globally and for LAC countries. Additionally, FAO states that the proportion of fish landings entering international trade has increased from 25% in the mid-1970s to 38% in 2022 (SOFIA 2024 report).
Moreover, data detailed further on reveal that global fishery products exports have grown from USD 34.8 billion in 1976 to USD 193.7 billion in 2022 (2022 currency).[3].
FAO figures from its SOFIA 2022 publication further show that global exports of FP of animal origin (excluding algae) represent 49% of the total for meat plus FP in 2020. This compares to 19% for beef, 18% for pork, 11% for poultry, and 3% for other meats.
Currently, many countries face a decline or even depletion of their coastal fisheries, which supplied both rural and urban centers to varying degrees. A significant portion of these catches is attributed to artisanal fishers, who traditionally use basic production methods and exhibit relatively low organizational levels, particularly in LAC, Africa, and parts of Asia. Consequently, many of these nations now import FP to cover the deficits resulting from these declines, often opting for highly competitive products that challenge their domestic fishing and aquaculture industries. These industries must improve their competitiveness through new technologies and higher labor productivity or risk losing competitiveness and, eventually disappearance in the medium or long term.
The United States imported 70% to 85% of its domestic FP consumption in recent years, despite its highly developed extractive fishing industry. This is due to self-imposed limitations on aquaculture expansion driven by public pressure and lobbying by traditional fishing interests. These limitations exist despite available technologies, abundant space, and financial and human resources . Interestingly, this has occurred up to now even if the country's substantial levels of external debt are pressuring a reevaluation of this strategy. In 2022, the US annual fishery product trade deficit amounted to approximately USD 26.457 billion, driven by imports of USD 32.392 billion and exports of USD 5.935 billion. This deficit has grown at an annual compounded average growth rate (CAGR) of 2.7% since 2000.[4]. Esto sucede, aunque sus enormes niveles de deuda externa parecen estar forzando a reconsiderar esta estrategia, ya que el déficit anual del comercio pesquero actual alcanza a unos U$ 26.457 MM en 2022, como producto de importaciones de U$ 32.392 MM y exportaciones de U$ 5.935 MM, déficit que aumenta a una tasa media acumulativa anual (en adelante TMAA) de 2,7% desde el año 2000.
Fishery trade is also significant in the EU, which stands out in both exports and imports (USD 40.22 billion and USD 63.31 billion, respectively, in 2022), although much of this trade is intra-regional. Interestingly, these countries also generate many technologies applicable to fishing and aquaculture, but their aquaculture industry remains relatively minor and underdeveloped. This paradox, likely caused by bureaucratic governance, lack of space, and other factors, presents interesting opportunities for exporters from various regions, and opens good perspectives for investments abroad.
Europe leads global FP exports by continent, with 15.1 million metric tons annually in 2020/2022, valued at USD 74.76 billion per year (2022 dollars) over the same triennium. Asia follows closely with 14.4 million metric tons and USD 73.273 billion annually in the same period. Notably, Asia’s exports have grown at a CAGR of 3% between 2000 and 2022, while imports grew at a CAGR of 2.5%.
In Latin America and the Caribbean (LAC), international fish trade holds great significance as it consistently generates positive net flows (exports minus imports) of foreign currency, reaching USD 21.555 billion annually in 2020/2022, as a result of exports worth USD 27.607 billion and imports worth USD 6.052 billion annually in the same three-year period. In the region, exports grow at a CAGR of 3.3% while imports grow with a CAGR of 4.7% between 2000 and 2022.
In recent years, fishery product (FP) exports involve between 30% and 40% of global landings, a figure that very well describes the level of competition and the need for competitive sectoral industries worldwide, since domestic production can almost always be challenged by imports from other regions or must compete with multiple suppliers in the export markets.
Thus, international fish trade, which involves 42.8 million tons of final product exported, valued at USD 193.683 billion in 2022, becomes enormously relevant in the current and recent activities of fishing and aquaculture worldwide and in many regions, and will continue to significantly affect the fate of this industry in the foreseeable future. These values contrast with landings of about 222 million tons valued at approximately USD 472 billion ( ex-farm value) in the same year .
PRODUCTION AND CONSUMPTION
Global fishery production, excluding algae, mammals, products recorded in units rather than weight, and some minor products such as shells and sponges, reached 185 million metric tons in 2022. Of this total, 91 million metric tons came from fishing and 94 million metric tons from aquaculture. For the first time, aquaculture production surpassed extractive fishing that year. China accounted for 35.6% of the total, contributing 15.3% of the extractive fishing output and a substantial 57.1% of global aquaculture production.
Marine fishing accounted for 87.6% of global catches, while freshwater extractive activities meant 12.4% in 2022. In aquaculture, however, only 37.4% of harvests occurred in marine environments, while 62.6% were from freshwater systems.
During the 1980s (1980/82-1990/92), global aquaculture volumes grew from 5.2 to 14.1 million metric tons annually (CAGR of 10.5%). Between 1990/92 and 2000/02, volumes reached 34.6 million metric tons annually (CAGR of 9.4%). This growth rate slowed to 4.2% during the 2010s (2010/12-2020/22). In value terms, aquaculture production sales grew from USD 58.917 billion to USD 97.273 billion (CAGR of 5.1%) in the 1990s, increasing to a CAGR of 7.7% during the 2000s, then decreasing to 4.8% in 2010/12-2020/22, with annual sales reaching USD 327.277 billion per year in 2020/2022. In contrast, extractive fishing showed volume increases with a CAGR of 2% in the first decade but only 0.2% in the most recent period, following a negative growth (CAGR of -0.3%) during the 1990s. This shift underscores aquaculture's emergence as the primary source of future fishery supply growth, given the plateauing of capture volumes despite international efforts to improve fisheries management.
Additionally, global fishing and aquaculture provide approximately 62 million jobs in primary activities, whether full-time, part-time, occasional, or undefined (SOFIA 2024). Of these jobs, 54% are related to fishing, 36% to aquaculture, and 10% remain unspecified.
For a global population of 6.914 billion in 2010 and 7.947 billion in 2022, the average apparent per capita consumption of fishery products rose from 18.5 to 20.2 kilograms per year. The highest per capita consumption levels are found in Asia, Europe, and Oceania, with 24.6, 21.9, and 21.4 kilograms per person, respectively. In the Americas, consumption stands at 14.6 kilograms/year, and in Africa, it is a minimal 8.9 kilograms in 2022. In the case of LAC, the figures are among the lowest globally, reaching only 10.2 kilograms per person that same year, somehow fluctuating between 2010 and 2022.
FOREIGN TRADE
Fishery product exports have increased significantly over the past decades, from 17.5 million metric tons annually in 1990/1992 to 41.7 million metric tons in 2020/2022 (CAGR of 2.9%). In value terms, exports grew from USD 87.536 billion to USD 203.118 billion annually in the same period (CAGR of 2.8%). Europe stands out as the leading exporting continent, with 15.1 million metric tons and approximately USD 74.8 billion annually in 2020/2022, accounting for 36.8% of the global value and 36.2% of global volumes. Asia follows closely, with 36.1% of the value and 34.4% of the total volume during the same triennium.
Conversely, imports rose from 18 million to 41.1 million metric tons annually between 1990/1992 and 2020/2022 and from USD 99.4 billion to USD 201.564 billion annually in the same period. Europe and Asia dominate as primary importers (Table 1).
Despite being the world’s top exporter of fishery products, Europe has recently become the continent with the highest negative export balances (exports minus imports) in value terms. However, in the past decade ending in 2022, Europe showed positive balances in exported volumes. Asia, on the other hand, consistently records negative export balances in volume but positive balances in value in recent years. This phenomenon occurs because continents like Africa and Asia export products with a higher average value per kilogram than their imports. In contrast, the Americas (largely influenced by U.S. figures) and Europe tend to exhibit the opposite pattern.
The top ten countries by export values in 2020/2022 account for 51.4% of those totals and 44.8% in volume-terms. China leads the global fishery export effort with USD 24.29 billion annually in 2020/2022 and a CAGR of 7.1% over the 30 years from 1990/92 to 2020/2022. Vietnam has the highest growth rate in both value and volume (CAGR of 10.4% and 12.3%, respectively) during the same period (Table 2). In contrast, Thailand shows only marginal growth, with a CAGR of just 0.2% in value. Ecuador and Chile are the standout fishery exporters in LAC, each exceeding 4% of world export values in 2020/2022. At the same time, the leading importers are mostly high-income economies, except for China, which is categorized by the World Bank as an upper-middle-income nation. (Table 3).
[1] https://data.worldbank.org/topic/trade?_gl=1*fc2whe*_gcl_au*NzAyOTA4MDEyLjE3MjE1OTkyMzM., Visited August 7, 2024
[2] FAO, 2024. The state of world fisheries and aquaculture https://doi.org/10.4060/cd0683es
[3] Unless otherwise indicated, all monetary values in this monograph are expressed in 2022 dollars, using the wholesale price index for all products as a deflector.
[4] NOAA estimates that more than 50% of its fishery imports are aquaculture products.
[5] Export values correspond mostly to FOB figures, although several countries express them in other terms (FAS or others). Imports are mostly expressed in CIF terms.
[6] Available statistics do not allow us to distinguish between fishery and aquaculture products.
[7] Source: Landed volume: FISHSTAT, FAO 2024. Value: SOFIA 2024, FAO. Export volumes are expressed in tons of final product weight, while landings are expressed in tons of live weight, so they are not directly comparable.
[8] With a few exceptions, exports are expressed in FOB values, and imports in CIF figures. Some countries present figures that do not coincide with the normal annual calendars, since they close their fiscal years in months other than December. This means that the export balances that are calculated often show balances of different amounts.
Table 1 International trade in fishery and aquaculture products between 1990 and 2022, by continent (annual averages for each triennium)
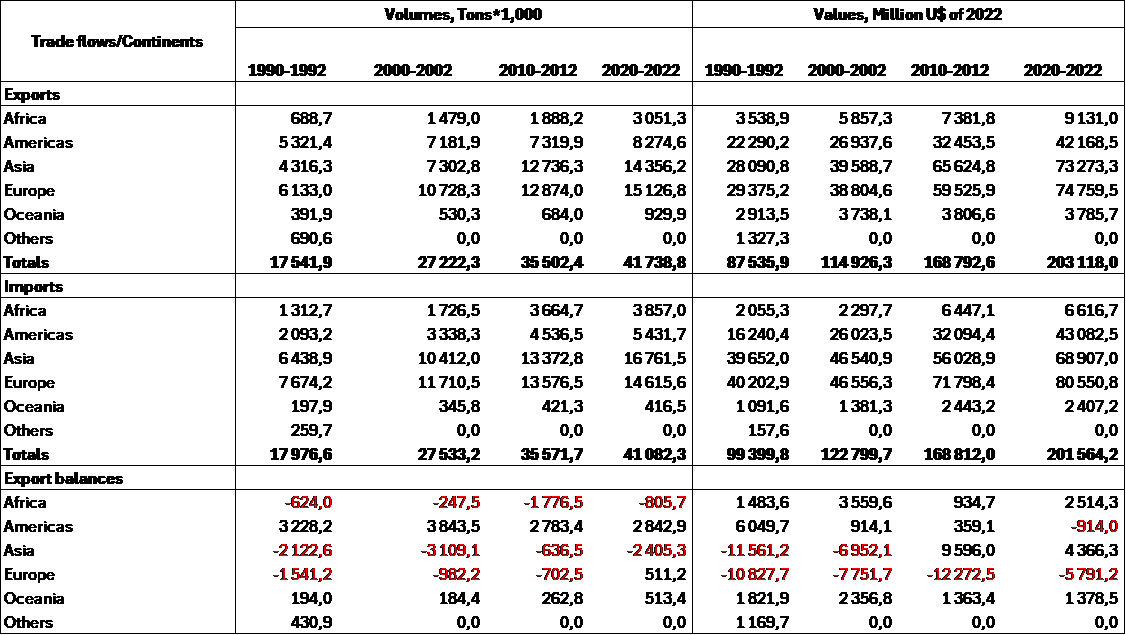
Source: Study calculations, based on FAO figures, Fishstat 2024
Table 2 Main exporting countries of fishery products by value in 2020/2022, and their records as from 1990/1992. Figures from 1990 to 2022.
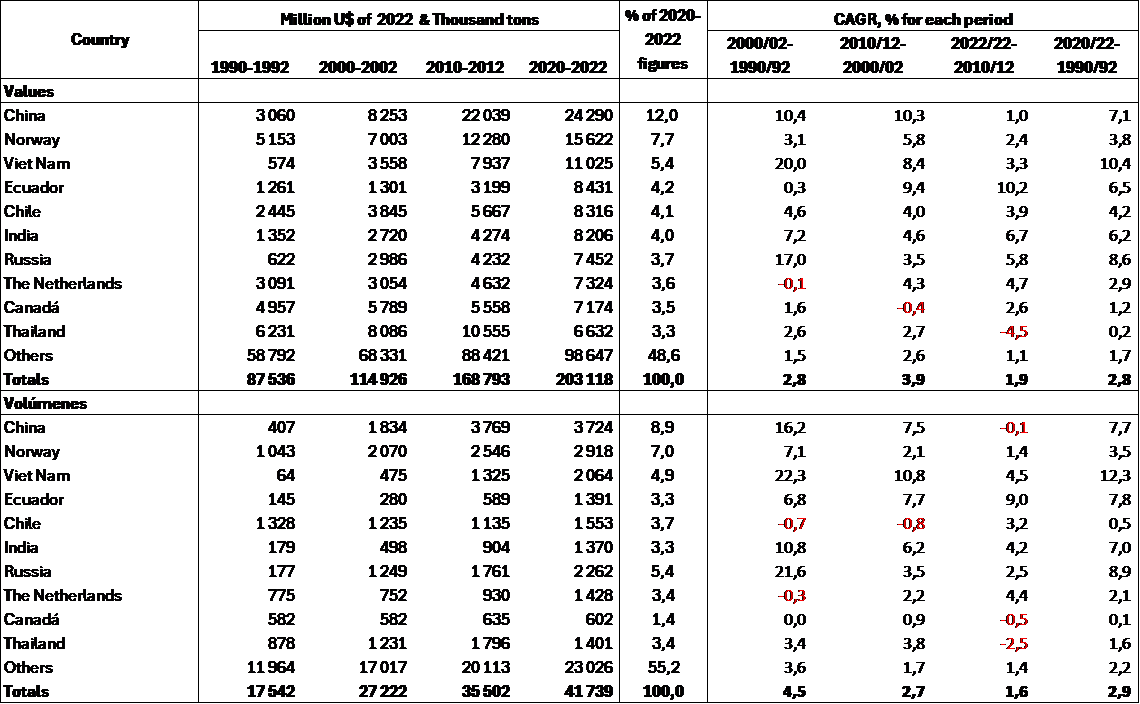
Source: Study calculations, based on FAO figures, Fishstat 2024
Table 3 Main importing countries of fishery products in 2020/2022 and their records as from 1990
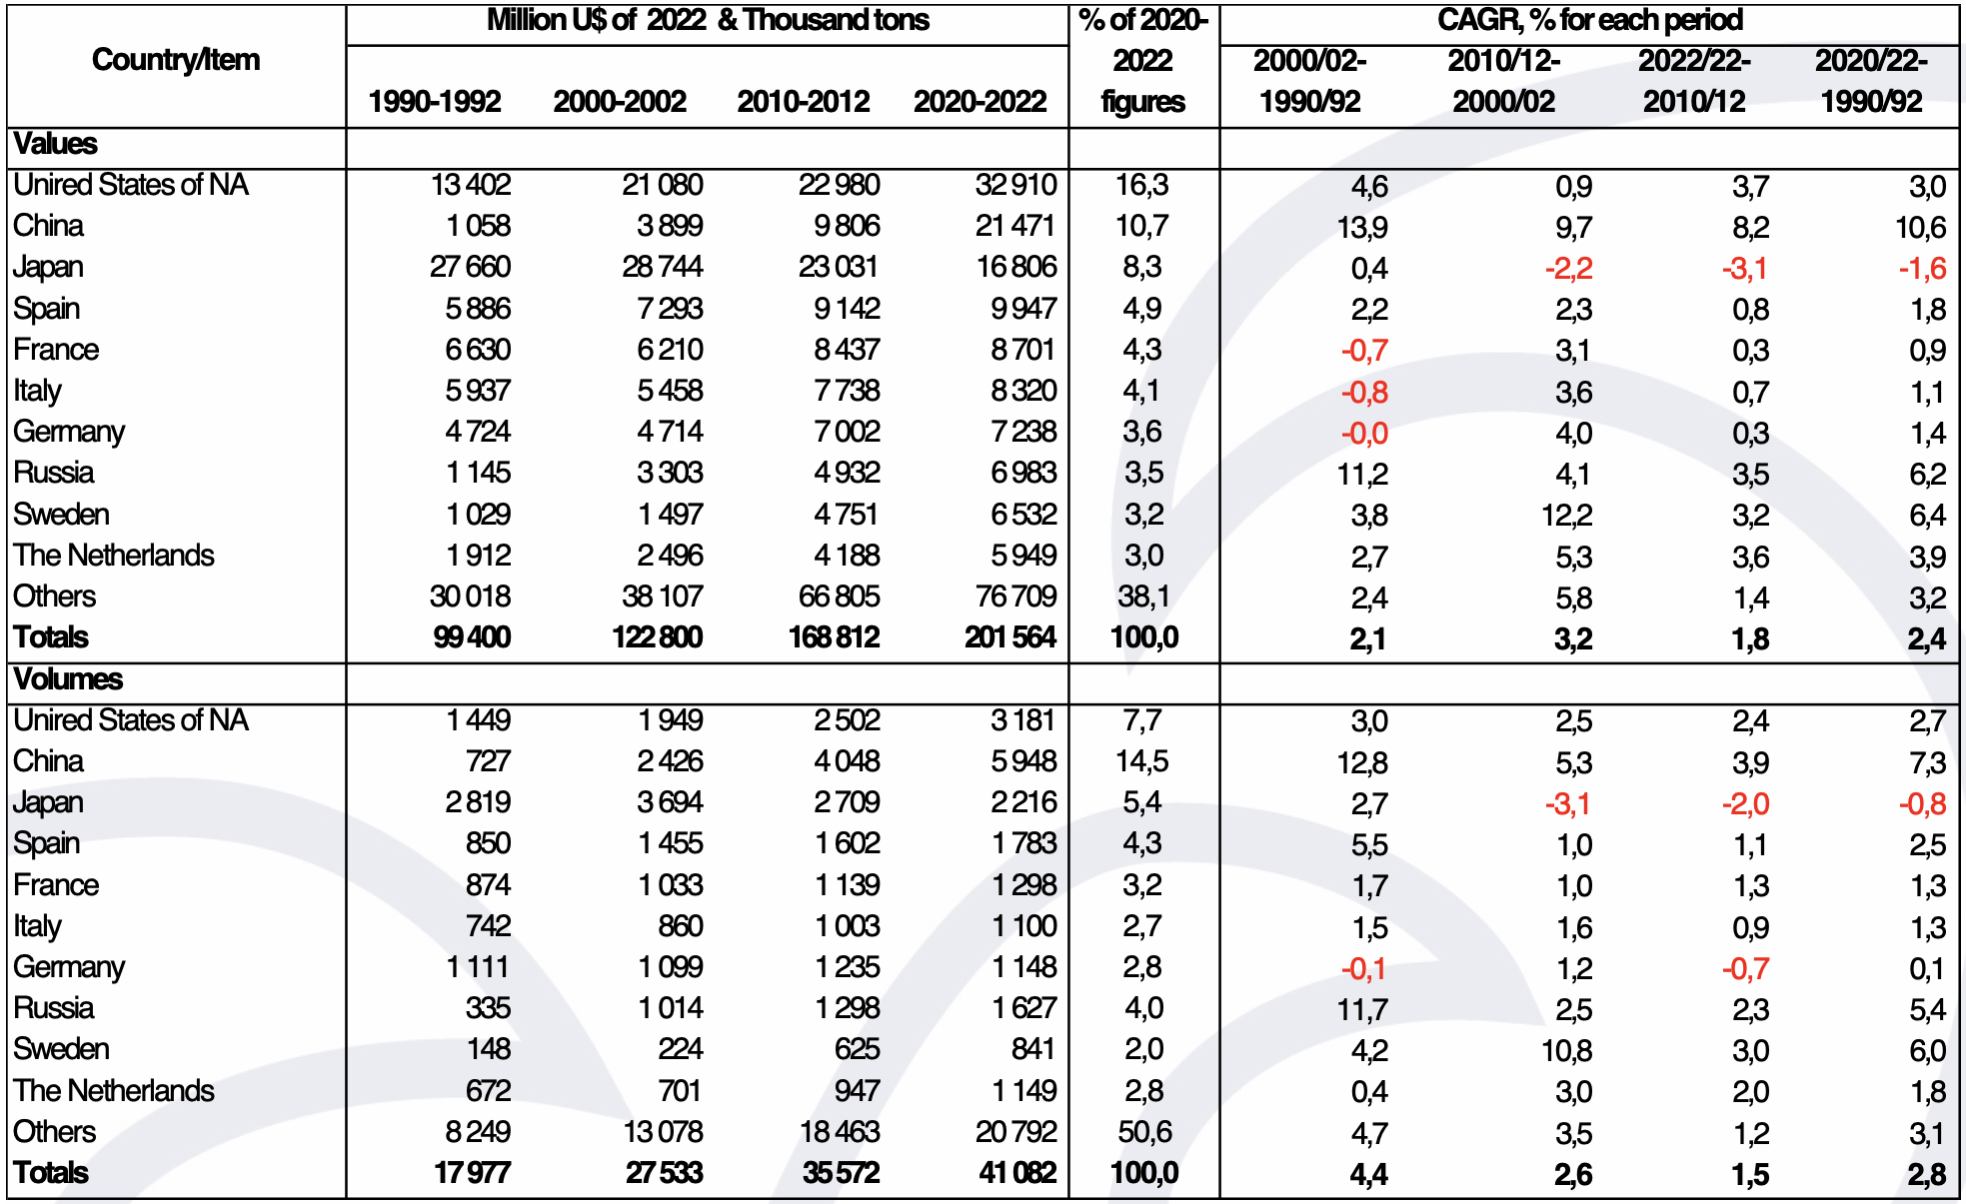
Source: Study calculations, based on FAO figures, Fishstat 2024
Meanwhile, the main importing countries are high-income economies, with the exception of China, which is classified by the World Bank as an upper-middle-income nation (Table 3).
The top 10 importing countries account for 61.9% of world values and 49.4% of volumes in 2020/2022. The United States of NA, China, and Japan dominate the import scene. The first of these concentrates 16.3% of the value and 7.7% of the volume of world imports in 2020/2022, and its fish imports increase at a CAGR of 3% in value and 2.7% in volume terms in the last 30 years. Here, the rates of change in imported volumes have fallen from 3.0% to 2.4% annually in the last three decades, and those for values have risen and fallen, ending with a CAGR value of 3.7% between 2010/2012 and 2020/2022. China, in turn, acquires 10.7% of the values and a prominent 14.5% of the world's import volumes in 2020/2022, and also shows declining decadal CAGRs in the last thirty years, even if they average significant 10.6% and 7.3% per year in value and volume terms during those 30 years, respectively. Japan continues to be a relevant importer of fishery products, with US 21,471 million tonnes per year and 2,216 million tonnes per year in 2020/2022, but its CAGRs in value and volume terms have systematically decreased in the last three decades, partly due to low growth in its economy, the decrease in its population from 128.1 million inhabitants in 2010 to 124.9 million in 2021 and by a certain satiety level in sectoral consumption.
Table 4 Latin America and the Caribbean: International Fish Trade by Region, 1990-2022
Annual averages for each triennium
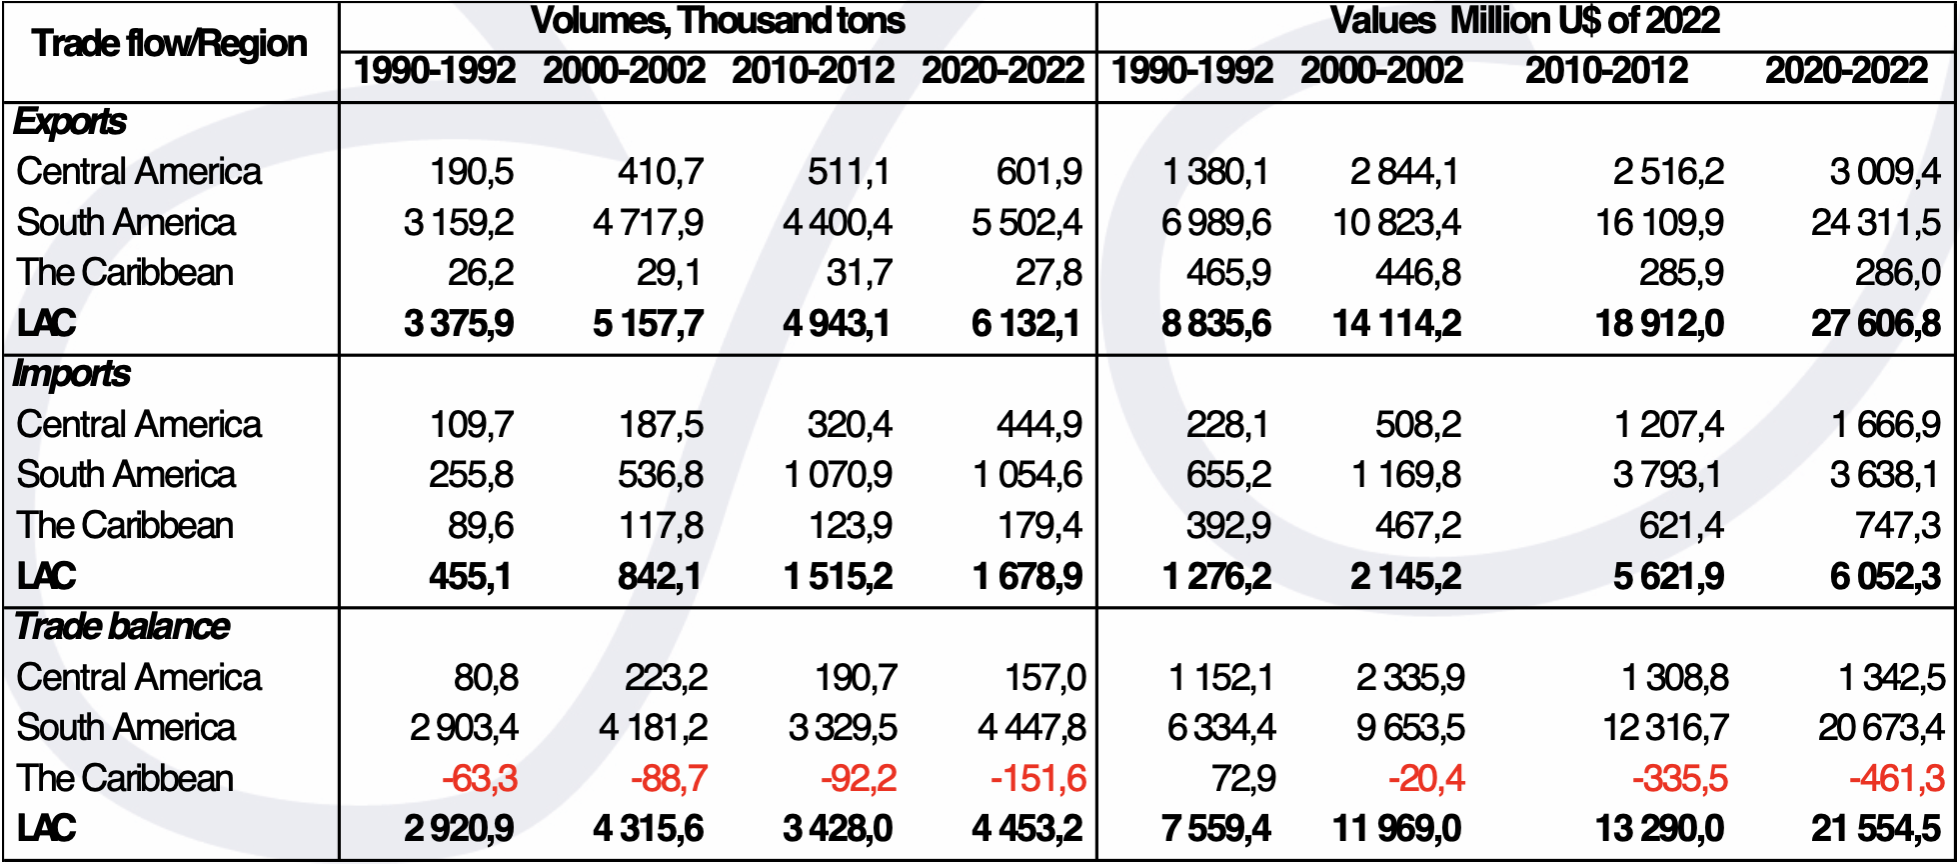
Source: Study calculations, based on FAO figures, Fishstat 2024
In the case of Latin America and the Caribbean (LAC) exported volumes increased from 3.4 million to 6.1 million tons per year (81.6%) and values, by 212.4% (from US$ 8,800 million to US$ 27,600 million per year) between 1990/1992 and 2020/2022. South America stands out here, with 89.7% of the volumes and 88.1% of the values exported by the region in the period (CAGR of 1.9% in volume and 4.2% in value) while Central America grows rapid as well, at CAGR rates of 3.9% in volume and 2.6% in value, exceeding the US$ 3,000 million exported annually in 2020/2022. For its part, the Caribbean exports only about 27.8 thousand tons per year in 2020/2022 valued at US$ 286 million annually, with a growing trade deficit in recent decades reaching US$ 461.3 million per year in the same three-year period. In the latter case, there are no visible possibilities of significant increases in local fish production to reverse the growing imports balances of these products.
It is also notable that imports of fishery products into LAC have increased by 268.9% in volume and 374.2% in value in the same period, a situation that has made it possible to balance and even increase total fish consumption by 20% between 2010 and 2021 (from 5.6 to 6.7 million tons; CAGR of 1.6%) to reach an apparent intake per person of about 10.2 kilos in that last year, one of the lowest in the world, only above the levels of 9.6 kilos per person in Africa (2021). This increase in LAC consumption occurs underpopulation growth of 11% in the same period (1% CAGR), bringing this subregion to a level of 656.1 million inhabitants in 2021.
Table 5 LAC: Main exporting countries of fishery products in the region, and their levels of foreign sales in 2020-2022 and previous decades
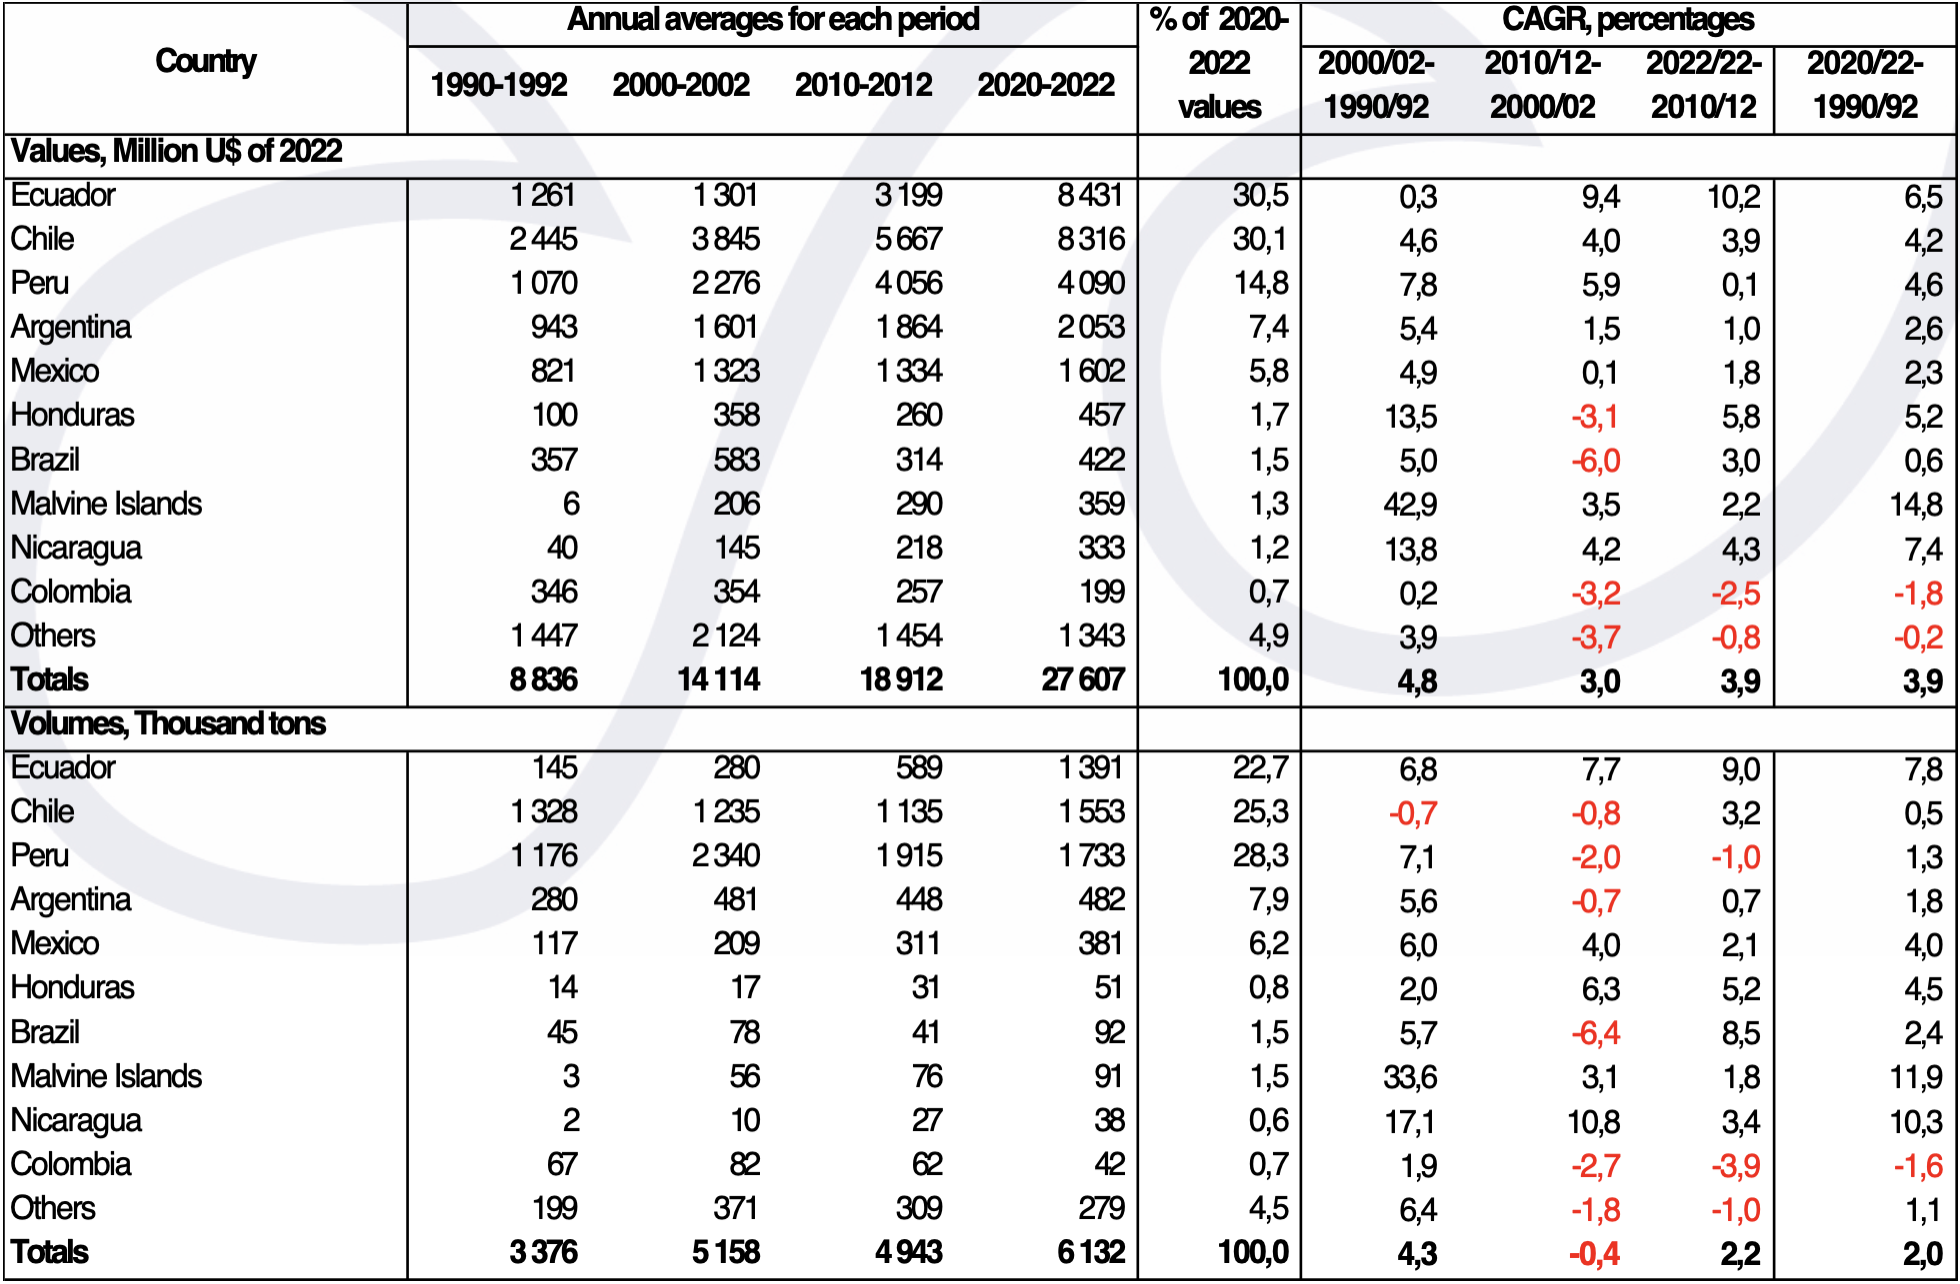
Source: Study calculations, based on FAO figures, Fishstat 2024
As indicated, LAC has export trade surpluses of 4.5 million tons per year in 2020/2022, with an extraordinary value of US$ 21,555 million annually in the same three-year period, a figure highly appreciated in many countries to help balancing and/or to generate positive trade balances in national foreign trade figures (Table 4). LAC accounts for 4.4% of global harvests and for 14.4% of extractive fisheries in 2020/2022. However, local aquaculture accounted for only 1.8% of world harvests in 1990/1992, while fishing contributed an outstanding 20% of world catches in that period. In turn, this subcontinent accounts for 13.6% of world export values and 3% of world import values of fishery products in 2020/2022.
Ten LAC countries account for 95.1% of the values and 95.5% of the volumes of FP exported by the region in 2020/2022 (83.6% and 94.1% in 1990/1992, respectively) (Table 5). Exports from Ecuador and Chile stand out, with more than US$ 8,000 million per year each in 2020/2022, and from Peru, with over US$ 4,000 million. These three countries account for 75% of the values and 76% of the volumes exported by LAC in that three-year period, mainly associated with shrimp farming, in Ecuador; farmed salmon, trout and mussel in Chile, and fishmeal in Peru.
Table 6 LAC: Main importing countries of fishery products in the region, and their levels of purchase abroad in 1990-2022
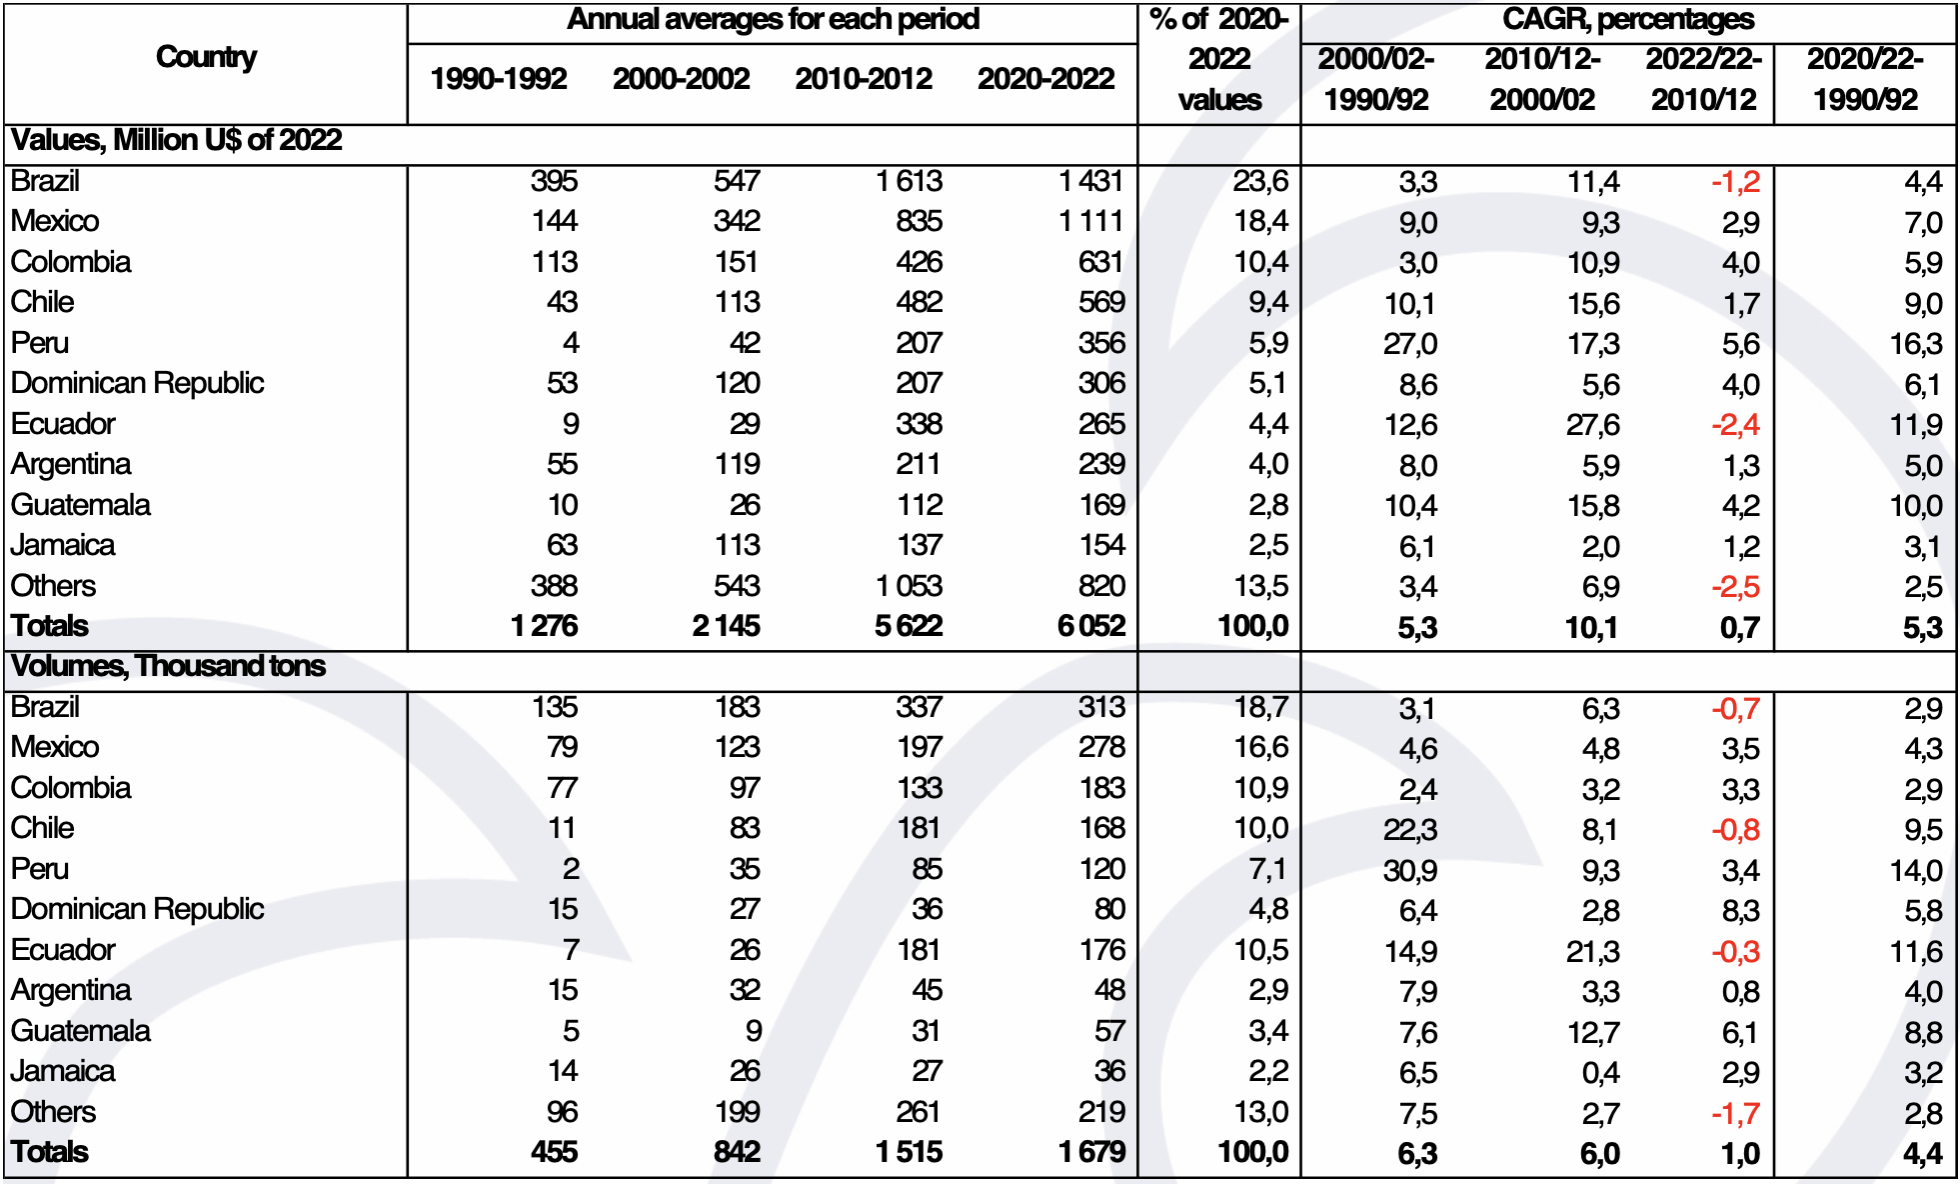
Source: Study calculations, based on FAO figures, Fishstat 2024
On the other hand, the CAGRs of exported values are growing faster (between 4.8% and 3.9% per year in the last three decades) than the rates of volumes (4.3% to 2.2%, respectively), even having experienced a decline of -0.4% in the 2000s.
Brazil, Mexico and Colombia are the main LAC importers of FP, accounting for 52.4% of the values and 46.2% of the volumes in 2020/2022 (51.1% and 63.8%, respectively in 1990/1992). At the same time, the 10 main importing countries account for 86.5% of the values and 87% of the volumes purchased abroad in 2020/2022 (69.6% and 78.8% in 1990/1992, respectively).
Brazil alone imports US$ 1,431 million per year in 2020/2022, a figure exceeded in 2014, with values above US$ 2,000 million and also exceeded in 2015 to 2019 with US$ 1,600 million per year. Mexico, with over US$ 1,600 million of annual imports in 2020/2022 and figures that exceed US$ 1,000 million since 2013 (except in 2020, with US$ 950 million due to Covid-19), is also a prominent regional exporter of FP.
Chile and Peru, countries with significant surpluses in landings and fish exports, are also unable to satisfy their domestic consumption needs except through growing and sustained imports. In part, this is due to the drop in artisanal landings from coastal fisheries and other fisheries for human consumption, and because a good part of their farmed products show high commercial value (shrimp, salmon and trout), out of reach for a good fraction of local consumers. Of course, part of the imports also refer to products that do not exist in these countries, increasingly demanded by various consumer groups.
Fresh, chilled or frozen fish, with 22.3 million tons per year, constitute 53.3% of the volumes and 44.6% of the FP values exported worldwide in 2020/2022 (average value of U$ 4.1 per kilo). In 1990/1992 they only accounted for 41.2% of the values but 48.2% of the volumes sold abroad.
Global sales of these fresh, chilled and frozen products have been particularly favored by technological improvements in production and sales chains, in air and maritime transport and the growing urbanization of the population, an increase in people's income and better levels of education.
Live, fresh and chilled/frozen crustaceans and molluscs (Table 7) follow next, with 15.8% of the volumes (6.6 million tons per year) and an important 26.7% of the value (U$ 54,180 million per year) in 2020/2022.
Table 7 World exports of fishery products by FAO major group, 1990-2022
Annual average values for each triennium
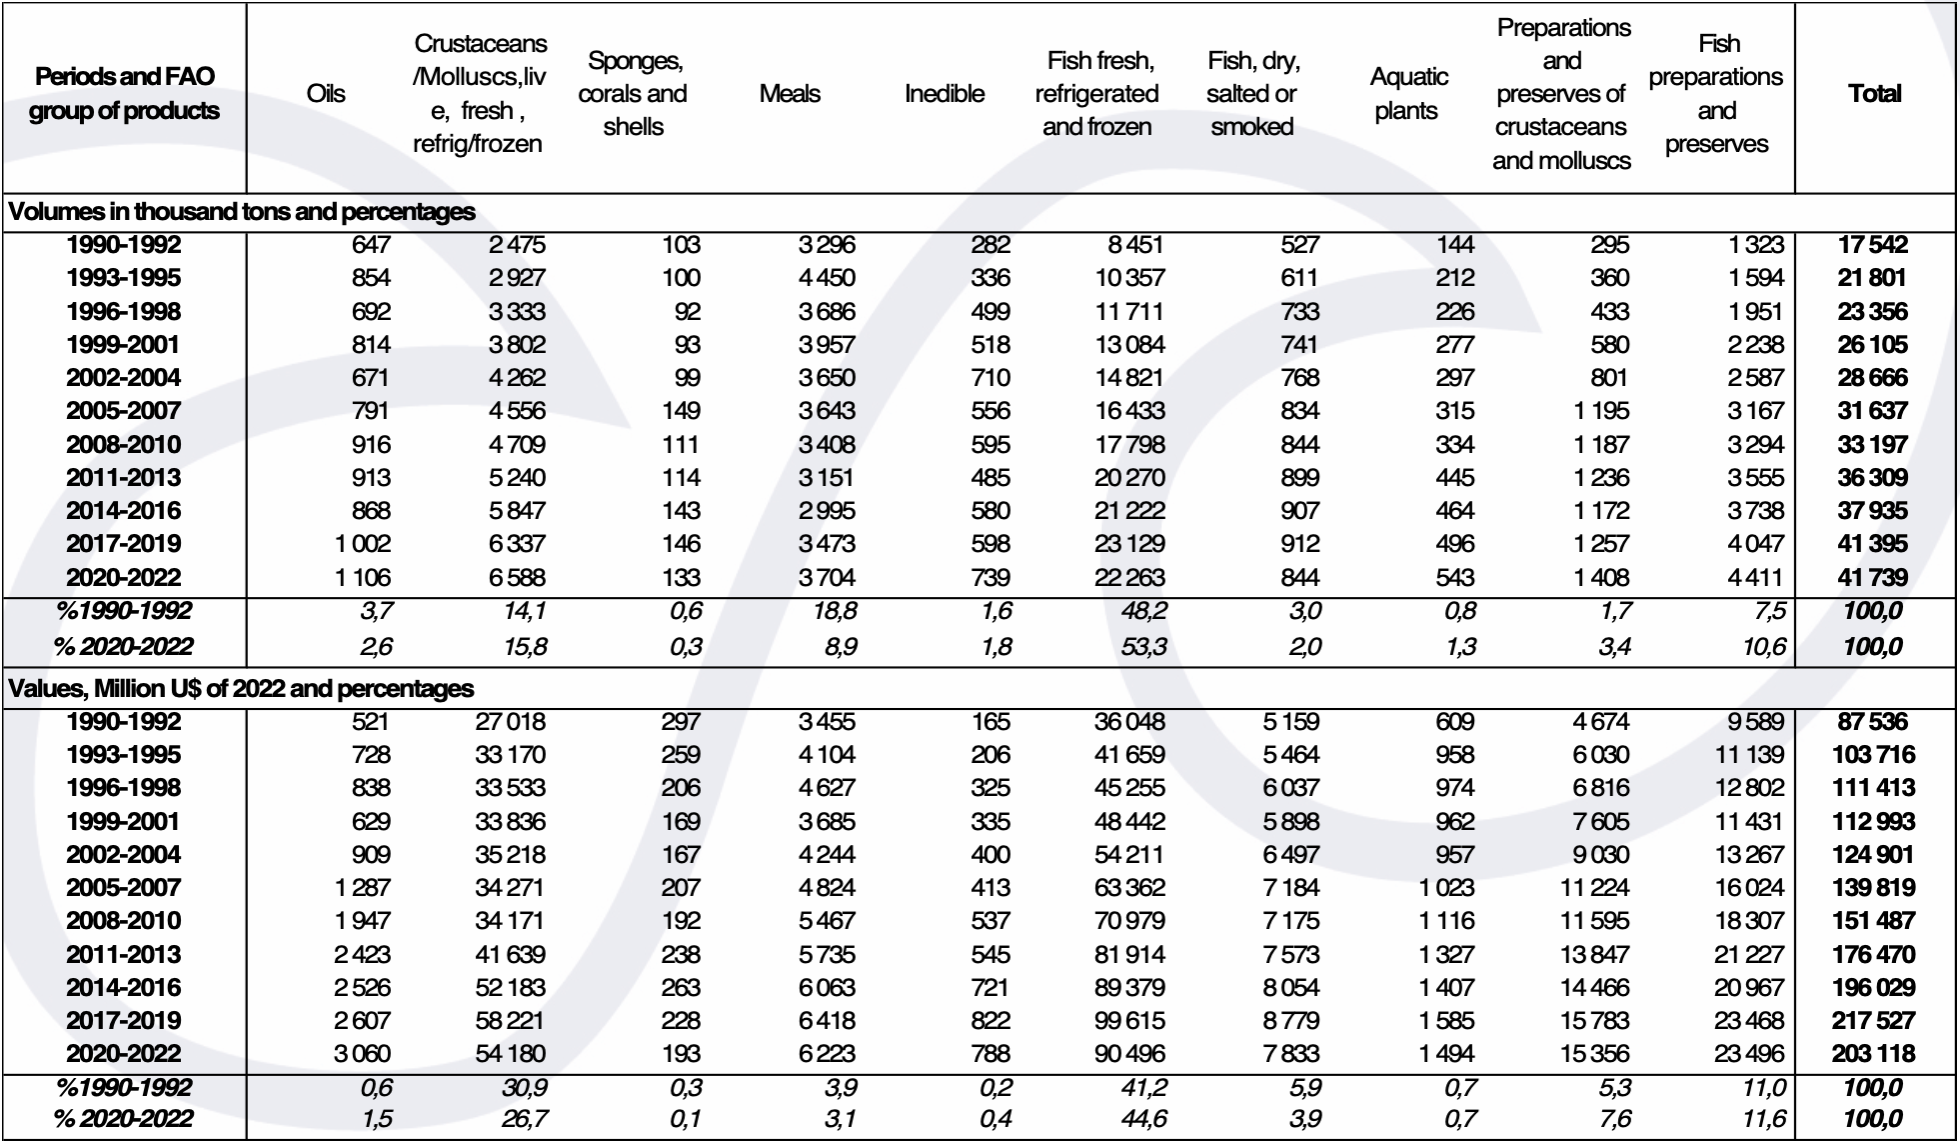
Source: Study calculations, based on FAO figures, Fishstat 2024
It can be calculated that canned crustaceans and molluscs, together with fish and aquatic plants, are the three items that have increased their CAGRs in volume export terms the most in the last 30 years ended in 2022, at a rate of 5.4%, 4.1% and 4.5%, in each decade, respectively. The same is not true in terms of value growth terms, as here CAGRs of oils, inedible and canned crustaceans and molluscs stand out, with values of 6.1%, 5.4% and 4%, respectively. In fresh, chilled and frozen fish, export values have grown by a CAGR of 3.1% in volume and with a CAGR of 3.3% over the last 30 years.
Table 8 Main fishery products exported between 1990 and 2022, by SITC-4 code
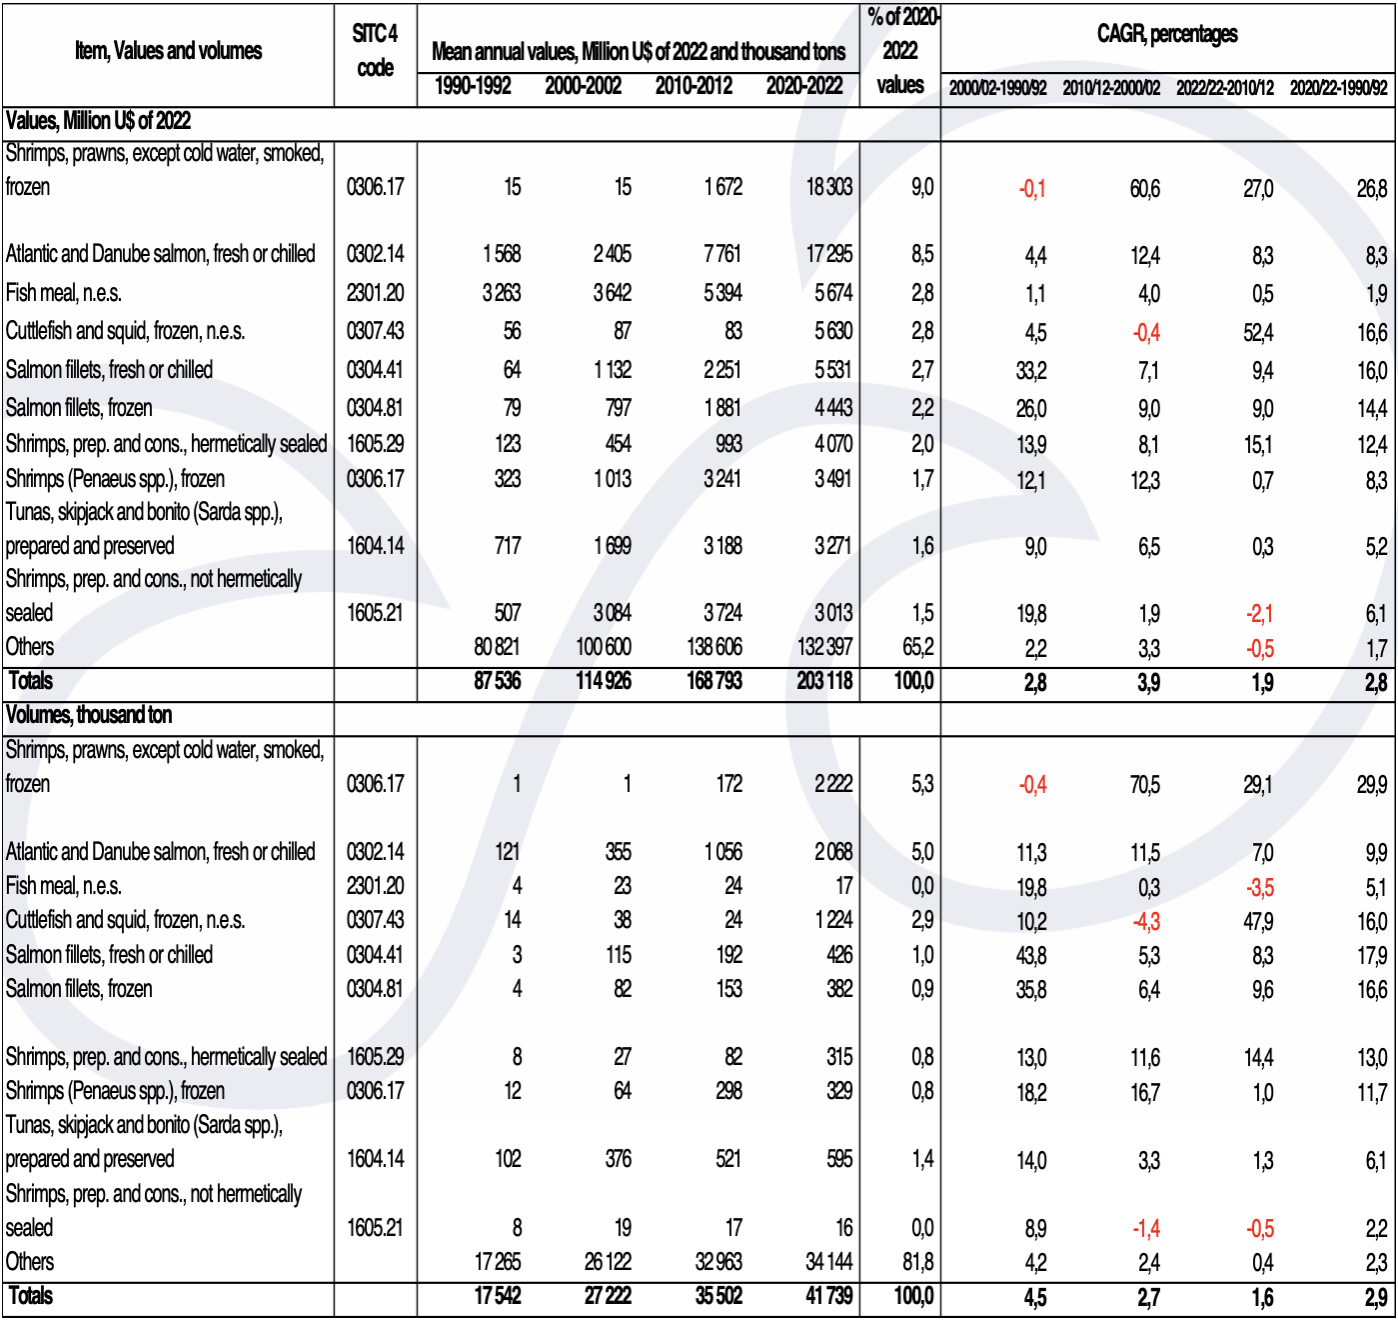
Source: Study calculations, based on FAO figures, Fishstat 2024
SITC-4 : Standard International Trade Classification, Revision 4, 2008
In 2020/2022, exports of smoked and frozen warm-water shrimp and prawns predominate with US$ 18,303 million per year (9% of the total) and 2.22 million tons (5.3% of the total). Next follows fresh or chilled Atlantic and Danube salmon with US$ 17,295 MM (8.5% of the total) and 2.07 MM tons (5% of the total) in the same period. At the same time, the 10 most outstanding products contribute 34.8% of the values and 18.2% of the volumes exported in 2020/2022. It is neither surprising that several of the top 10 products are also related to shrimp and salmon. Also 5 of these 10 products show CAGRs of over 10% in value, while 6 of them exceed that percentage in terms of volume. Except for the case of frozen cuttlefish and squid, the other products that grow faster in exports value and volume terms (CAGRs greater than 10%) come mainly from aquaculture.
Table 9 International trade in fishery products, according to countries' income level
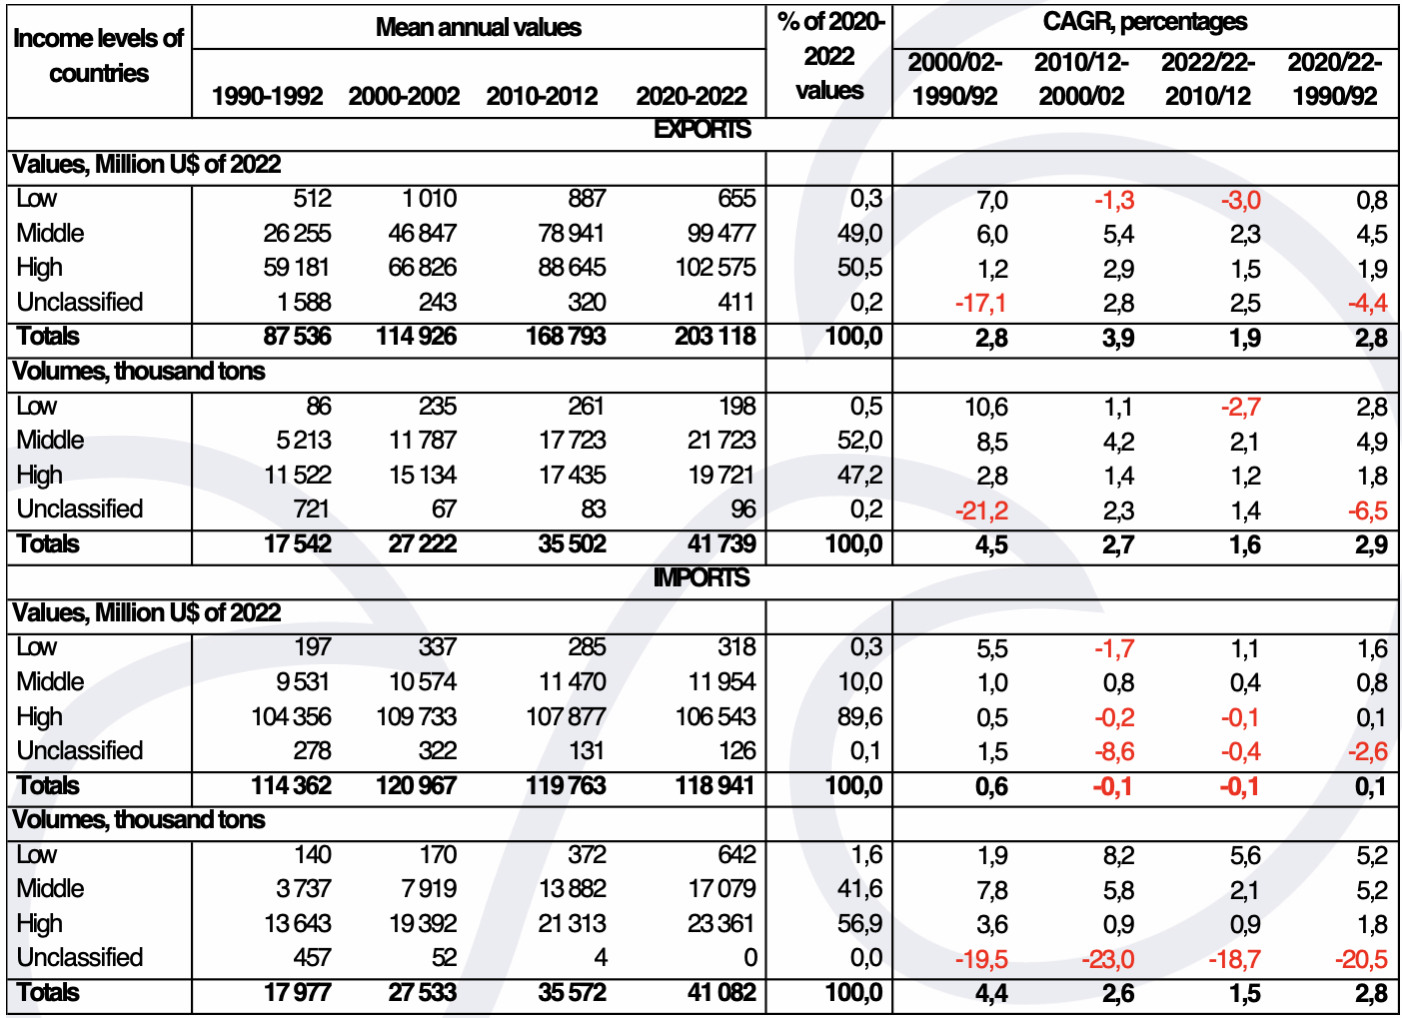
Source: Study calculations, based on FAO figures, Fishstat 2024
Countries Ranked by Income Category, World Bank, 2024
International fish trade can also be analyzed based on the income levels of countries, according to World Bank criteria. This organization classifies countries according to their gross national income (GNI) per capita for 2023. The groups are as follows: low-income countries, with $1,145 or less; lower-middle-income countries, with incomes from that threshold up to $4,515; upper-middle-income countries, up to $14,005; and high-income countries, with incomes exceeding $14,005.
In 2020/2022, 50.5% of the value and 47.2% of the volume of exports originated from high-income countries. It is clear that high-income countries have lost their dominance in these exports over time, as they accounted for 67.6% of the value and 65.7% of the volume of global exports in 1990/1992. The opposite trend is observed in middle-income countries (notably China and India), which contributed only 30% of the value and 29.7% of the volume of FP exports in 1990/1992, rising to 49% and 52%, respectively, in 2020/2022, reflecting structural transformations in fishery exports trade over the past 30 years.
Similarly, high-income countries have slightly reduced their relative importance in global imports, from 91.3% to 89.6% in value and from 75.9% to 56.9% in total volumes between 1990/1992 and 2020/2022, respectively. In contrast, middle-income countries have increased their relevance, representing 10% of the total value of imports in 2020/2022 compared to 8.3% in 1990/1992, and significantly increasing their share of the trade volume, rising from 20.8% in 1990/1992 to 41.6% in 2020/2022. This highlights another significant transformation in global fishery trade, influenced by changes in several aspects including income levels, population growth, and degrees of urbanization, which have driven higher FP consumption in developing economies.
Thus, international fishery trade is and continues being a key driver of sectoral growth, supported by a process of globalization that has been on the rise. This trend has only recently begun to face challenges due to geopolitical reasons, making it difficult to predict how events will unfold in the coming decades, subject also to the facts and ideas discussed in the following paragraphs.
A LOOK INTO THE NEAR FUTURE
The latest FAO/OECD forecasts for 2032 indicate that fish production and international trade of FP will continue to grow, albeit at a slower pace than observed in recent years. Landings of animal-based species are expected to reach approximately 205 million tons by then, with 111 million tons from aquaculture and 94 million tons from capture fisheries. Between 2022 and 2032, fisheries are projected to grow by about 3%, while aquaculture will see a 17% increase. According to SOFIA 2024 projections, FAO estimates that aquaculture will account for 54% of total aquatic animal landings by 2032 (55% in 2033, compared to 51% in 2021-2023) and 60% of fish products intended for human consumption, which by then should reach about 184 million tons (186 million tons estimated for 2033), or roughly 90% of primary production. Asia is anticipated to contribute 77% of the production growth between 2024 and 2033.
Per capita fish consumption is projected to reach 21.3 kilograms in 2032 and 21.4 kilograms in 2033, driven by increased incomes, urbanization, technological advancements along the production chain, and higher education levels, among other factors. However, Africa’s per capita consumption is expected to decline to 9.3 kilograms by 2033—where fish products are crucial for local nutritional needs—and declines are also anticipated in Europe. Conversely, the highest growth rates will occur in Asia, building on its already high standards. By 2033, 83% of fishmeal and 70% of fish oil are projected to be used in aquaculture feed.
In Latin America and the Caribbean (LAC), meat consumption could increase by 3.3 kilograms per capita to reach 52 kilograms by 2033, surpassing the world average by 80%. This growth will mainly result from increased poultry and pork consumption, projected to grow at CAGRs of 0.8% and 0.7%, respectively, while beef consumption is expected to decline moderately. In turn, LAC per capita fish consumption—among the lowest globally—is expected to grow only by 0.3% annually.
Fish exports will also continue to rise, accounting for 34% of landings by 2032, compared to 38% in 2022. Additionally, real prices of fish and aquaculture products (expressed in U$ dollars of the same year) are projected to decrease by 15% and 11%, respectively, by 2033, though nominal prices will increase. These declines are mainly attributed to competition with other meats, particularly poultry, whose prices are expected to fall by 20% by 2033 due to higher production levels.
The European Union, the United States, China, and Japan will remain being the leading global importers of fish products by 2033, jointly accounting for 50% of this trade, a slight decrease from 52% in 2021-2023.
Production Challenges
The global figures outlined above remain attractive for the sector but already raise concerns about the slowdown in the virtuous growth patterns observed in recent decades. They are characterized by showing that extractive fishing levels have not grown significantly in over 30 years, while aquaculture remains being a very dynamic activity, even if faced with increasing challenges related to governance, environmental issues and sustainability, raising questions about whether past successes can be replicated in the near future.
Wild fisheries can improve their performance through better global management practices. Other contributing factors could include utilizing bycatch discards, improving post-harvest practices, and controlling illegal and indiscriminate fishing.
As well, overall supplies can also increase if losses along production and marketing chains are diminished, as currently they have been estimated to include about 30% of landed products .[1] Overestimate
Aquaculture, which already dominates and will continue doing so in fish production, faces questionable governance in many regions. This affects the speed and cost of securing farming concessions, with adequate durations and guarantees suitable for business needs. It also contends with growing conflicts over marine and inland water space and use, while the State usually lacks trained personnel to undertake its responsibilities as needed. Moreover, overregulation often imposes excessive costs and hinders agility in decision-making processes, and there is a trend to overvalue regulatory functions and norms, while long-term and adequate leadership, strategies and policies are poorly handled.
Small- and medium-scale aquaculture face high costs and difficulties in entering and sustaining operations legally. Organizational, marketing, and technical management issues are also present and require necessary and urgent state support, which often fails to arrive on time or adequately, leading to frustration among producers and society at large. In parallel, small-scale producers often lack the techniques to produce efficiently, competitively and sustainably, limiting sales opportunities beyond their organizational and marketing challenges. In parallel, small-scale producers often lack the techniques to produce efficiently, competitively and sustainably, limiting sales opportunities beyond their organizational and marketing challenges.
Particularly in the past 10–15 years, technological advancements have revolutionized aquaculture, with the emergence of land-based recirculating aquaculture systems (RAS) and offshore high-energy marine farming systems. These technologies are progressively facilitating the relocating of medium- and large-scale aquaculture operations to land (RAS systems) or open seas (offshore farming), leaving more coastal and inland waters to family or artisanal farmers who will dominate these areas in the medium and long term.
Efforts are also underway to diversify aquaculture by incorporating more species, particularly native ones, into local farming practices.
Despite advancements in environmental management within aquaculture, unresolved environmental, social, and economic issues persist, alongside new risks associated with climate change. These challenges, combined with activist opposition, indigenous rights demands, and the industry’s encroachment into traditional cultural areas, often tarnish the sector’s reputation and hinder the political support needed for sustainable growth.
Commercial Challenges
Trade also presents challenges, including competition from other meats like poultry and pork, tariff and non-tariff barriers, lobbying, financial resources, taxation, and currency and social policies. These factors plus certain degrees of saturation in various markets may threaten fishing and aquaculture development in certain countries, either through import "invasions" or an inability to organize production schemes for competitive exports. Consumer demands, economic growth, income levels, and perceptions of fish products continually affect demand and, consequently, supply. In aquaculture and other food production, long-term investment planning and systematic technological innovation are essential to meet all of these challenges.
Additionally, sustainable fish supply growth depends on promoting consumption by offering well-handled, uniform, predictable quality products throughout the year, with traceability and convenient processing, portioning and packaging to meet the needs of increasingly demanding consumers. Campaigns promoting fish consumption must be systematic and sustained rather than short-term and opportunistic. Here consumer’s education should start in childhood and continue throughout their life. In this respect it is sad to note that ‘opportunistic’ and short-term campaigns are often undertaken to boost consumption, being far from achieving sustainable objectives, as those can mainly be met through the requirements just exposed, with a better organized and competitive industry offering convenience products to a population that has to be convinced of the benefits of fish products and make use of the great variety of products available.
Expanding international fish trade requires not only deepening knowledge and sales in developed countries but also creatively tapping into emerging markets. The shift in global fish consumption and trade from high-income countries to middle- and low-income countries presents challenges but also opportunities for sectoral commerce. Industry will therefore have to become accustomed to new commercial circumstances, practices and conditions, perhaps associated with contracts of smaller volumes, shorter periods of time and new commercial practices.
Finally, the organized and competitive nature of poultry and pork industries—offering availability, predictability, standardization, and competitive pricing—poses a significant challenge to fish and aquaculture products. While the sector boasts a diverse product range, much of its production and trade still rely on a relatively small number of species. Greater technological and market efforts are needed to incorporate other species, deepen existing markets or open new ones.
CONCLUSIONS
Despite the challenges, figures suggest continued opportunities for growth in fish farming and international trade in the near future, albeit at slower rates than before up to at least 2033. This panorama requires new long and medium-term strategies from both governments and producers to foster better governance and competitiveness. Supporting small-scale producers with organizational, commercial, and technological assistance while addressing environmental, social, and economic issues is as well essential. For medium and large industries, continuous innovation processes are necessary to maintain global competitiveness.
While the future remains promising, the slowdown in production and trade should serve as a warning to reevaluate how the sector produces, improves efficiency across value chains, and markets its valuable products, and calls the attention on the fact that reinforced and purposeful leaderships and better governance are essential tools to support further and successful production and trade sectoral developments.
[1] SOFIA 2024, Spanish version, page 211
Oficina Central: Ciudad de Panamá, Panamá
Oficinas de representación: Chile, Ecuador, EE.UU. de N.A., México, Australia y Noruega
CONSTRUYENDO UN FUTURO AZUL…..